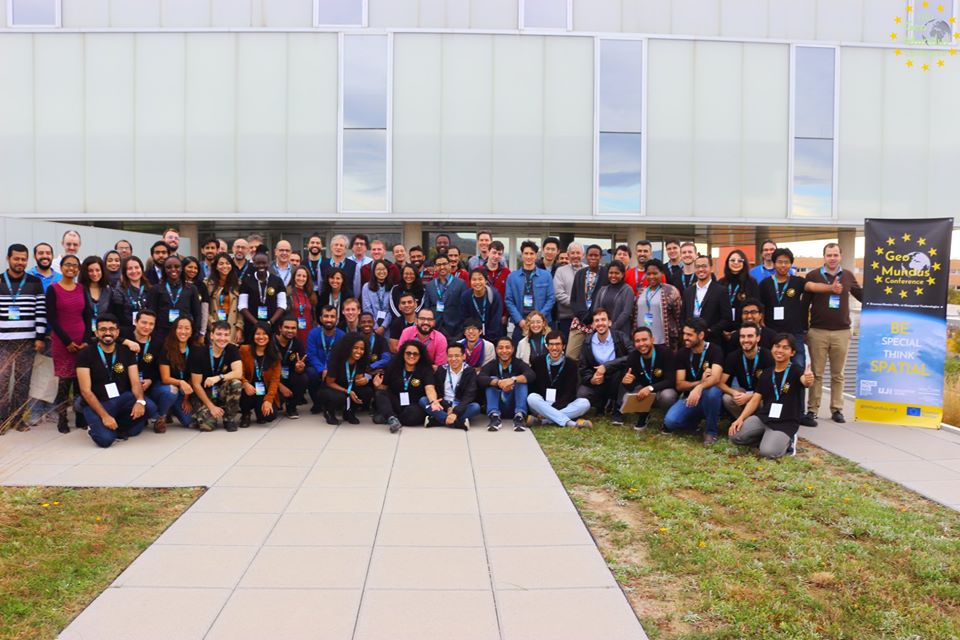
What is GeoMundus?

GeoMundus is a free international Conference organized by students for students. The organizing committee is the students from the Erasmus Mundus Master of Science in Geospatial Technologies. The conference aims to share cutting-edge scientific research, knowledge, and skills in the fields of Geospatial Technologies, Geoinformatics, and Geosciences, including but not limited to geographic information systems and sciences, spatial cognition, geography, and spatial data sciences.
Please see Programme Section for more detailed information.


Why GeoMundus?

GeoMundus is an opportunity to learn about and share scientific research, knowledge, and skills with other students and researchers of all things ‘Geo’. Every year it will give participants the chance to learn about technological advancements of GI, research activities and applications of geospatial technologies in today’s world. GeoMundus is unique, featuring workshops where participants can experience first-hand the future of the field as well as a career session specially designed for students interested in a geospatial career.

Who should participate in GeoMundus 2020?

Everyone who is curious about geospatial technologies and their applications. We especially welcome students, researchers, industry leaders, and interested members of the public. It is not only a great opportunity to learn, but also to network with the brightest minds in this exciting field.

The registration for the virtual conference is now closed.

Keynote Speakers

We are happy to introduce our keynote speakers, Dr. Paula Moraga, Dr. Gerald Blasch, Dr. Arun Kumar Pratihast, and Dr. Linda Beale. Please visit their personal websites to find out more about them.

Dr. Paula Moraga

Dr. Paula Moraga is an Assistant Professor of Statistics at the King Abdullah University of Science and Technology (KAUST) and the Principal Investigator of the Geospatial Statistics and Health Surveillance Research Group. Paula's research focuses on the development of innovative statistical methods and computational tools for geospatial data analysis and health surveillance, and the impact of her work has directly informed strategic policy in reducing disease burden in several countries. She has developed modeling architectures to understand the spatial and spatio-temporal patterns and identify targets for intervention of diseases such as malaria in Africa, leptospirosis in Brazil, and cancer in Australia, and has worked on the development of a number of R packages for Bayesian risk modeling, detection of disease clusters, and risk assessment of travel-related spread of disease. Paula has published extensively in leading journals and is the author of the book 'Geospatial Health Data: Modeling and Visualization with R-INLA and Shiny' (2019, Chapman & Hall/CRC). Paula received her Ph.D. degree in Mathematics from the University of Valencia, and her Master's degree in Biostatistics from Harvard University.

KEYNOTE:
“Geospatial Data Science for Public Health Surveillance”

Geospatial health data are essential to inform public health and policy. These data can be used to quantify disease burden, understand geographic and temporal patterns, identify risk factors, and measure inequalities. In this talk, Paula will give an overview of her research which focuses on the development of innovative statistical methods and interactive visualization applications for geospatial data analysis and health surveillance.


Dr. Gerald Blasch

Dr. Gerald Blasch is a Crop Disease Geo-Spatial Data Scientist at the International Maize and Wheat Improvement Center (CIMMYT). His work focuses on R4D of remote sensing (RS) and geospatial solutions for large-scale crop disease early warning systems, whereby he explores the potential of UAV-based high-throughput phenotyping for biotic stresses and satellite-based crop disease detection.
Overall, Gerald has 13 years of research and consultancy experience in (inter)national projects in the agriculture and development sectors of several countries (e.g. Australia, China, Ethiopia, Germany, Mexico, and the UK). As a researcher, he developed RS and GIS tools for precision and conservation agriculture, digital soil mapping, and environmental monitoring during his Post-Doc (Newcastle University, UK) and Ph.D. studies (GFZ German Research Centre for Geosciences, Germany), and consultancy activities (CIMMYT, Mexico). For instance, to optimize farm management, Gerald developed an easy-to-use tool for deriving yield zones in crop production system by applying Spatio-temporal analysis to large yield map time series using image analysis techniques such as pattern recognition and unsupervised learning. As a GIS expert (GIZ German agency of international cooperation, Germany; SEMARNAT, Mexico) he built and managed a GIS for waste management for the Mexican Federal Ministry of Environment and Natural Resources (SEMARNAT).

KEYNOTE:
“Wheat Rust Early Warning System in Ethiopia – Using New Technologies to Combat Crop Disease”

Wheat rusts pose a major threat to food security in Ethiopia, with several devastating epidemics in recent history. To help prevent major disease outbreaks, early detection and timely control are essential. In response to the wheat rust problem in Ethiopia, a consortium of national and international partners have created one of the most advanced, operational crop disease early warning and advisory systems in the world. This early warning system includes several advanced technologies and operates in near real-time within the wheat season. Key elements include near real-time field and mobile phone surveillance data, mobile nanopore sequencing diagnostics, meteorologically-driven spore dispersal, disease environmental suitability forecasting, and a platform for timely communication to policy-makers, extension agents and small-holder farmers. This keynote talk describes the existing early warning system and the planned development of additional, new components for enhancement based on artificial intelligence, machine learning, and remote sensing, such as UAV-based high throughput phenotyping for biotic stresses.


Dr. Arun Kumar Pratihast

Dr. Arun Pratihast is a Senior Data scientist at Wageningen Environmental Research, team Earth Informatics, Wageningen, The Netherlands with a passion for the effective application of data and technology for forest, biodiversity, and agriculture monitoring. He focuses on citizen Science, geoinformation technologies, mobile application development, open and big data flow, data standardisation, software engineering and how these can lead to user-friendly applications and quality decision making. He is also actively engaged in the training and capacity building activities of World Bank, SilvaCarbon Global Forest Observation Initiative in many countries around the world. He has also received Google Earth Engine Award 2015.

Arun has a PhD from Wageningen University entitled "Interactive community-based tropical forest monitoring using emerging technologies”. This PhD project was funded by Centers for Natural Resources and Development (CNRD), DAAD Fellowship Programme and was in collaboration with Institute for Technology & Resources Management in the Tropics & Subtropics (ITT), Cologne University of Applied Sciences, Cologne, Germany and the Laboratory of Geoinformation Science and Remote Sensing , Wageningen University, Wageningen, The Netherlands. Prior to coming to Wageningen, he completed his MSc. at ITC, University of Twente, Enschede, The Netherlands and his undergraduate degree in Computer Engineering from, Tribhuvan University, Nepal. A full list of publications can be found via his GoogleScholar or ResearchGate profile.

KEYNOTE:
“Community-based Tropical Forest Monitoring Using Emerging Technologies”

The unprecedented destruction of tropical forest cover has serious negative consequences on the regulation of the world’s climate cycle, biodiversity and other environmental variables. With rising global temperatures, improved forest monitoring, especially at the landscape scale has become increasingly important. Because forest changes manifest at a variety of spatial and temporal scales, effective monitoring will likely require an integrated approach, where detailed community-based in-situ observations are combined with remote sensing satellites. With these considerations in mind, this presentation will describe an integrated community based tropical forest monitoring system which combines emerging technologies, remote sensing and community-based observation in support of REDD+ monitoring, reporting and verification implementation.

Dr. Linda Beale

Dr. Linda Beale is the Group Lead for Location Analytics at Esri, with an interest in sharing the value of spatial analysis with an audience ranging from those new to the discipline to those who are seeking fresh approaches and techniques. A geographer by training, Linda gained her PhD in GIS, statistics and modelling, and led the geospatial health group in the Small Area Health Statistics Unit at Imperial College London. Linda has extensive experience in the field of spatial epidemiology and has worked closely with Health Departments, the World Health Organisation and Center for Disease Control. She developed the award-winning Rapid Inquiry Facility program for chronic disease modelling and was co-author on the landmark Environment and Health Atlas for England and Wales. Linda is the author of the first Esri MOOC, Going Places with Spatial Analysis, and she has published numerous peer-reviewed papers, book chapters, and been invited to keynote, present and deliver workshops at national and international conferences. Linda has worked at Esri since 2011, where her experience helps shape location analytics to provide the community with better and more powerful tools, and where she helps teach best practices and sharing of knowledge to develop understanding across the wider community.

KEYNOTE SUMMARY

Epidemiology sits at an intersection of a number of different disciplines and uses techniques from, for example, the fields of health, medicine, statistics and geography. Although the importance of the geographical component has historically been understood, interdisciplinary approaches to epidemiology and spatial analysis, where each discipline contributes and advances, are still a rarity. A number of geographical limitations impact epidemiological analysis, such as inconsistent geography, data scale/resolution, health and population data issues. In terms of epidemiological research, exposure misclassification, selection and ecological bias, rare diseases and confounding impact study design and methods. Combining the lessons learnt from both disciplines with advanced statistical approaches enables advances in both. In a world where epidemiology has gone from an almost unknown discipline to being a part of our everyday language and lives, due to COVID-19, this talk will explore the importance of the relationship between epidemiology and the geographical perspective.


Workshops

Dr. Julio Pedrassoli

Dr. Julio Pedrassoli has a PhD. in Geography from the University of São Paulo (USP) and a Bachelor's Degree in Geography from São Paulo State University (UNESP). Worked as Research Scholar at Columbia University/New York and as a consultant in Geographic Information Systems and Remote Sensing for the Pólis Institute on projects for monitoring, analysis, and evaluation in urban areas and natural environments. Nowadays is a Professor at the Federal University of Bahia (Brazil). Currently, develop scientific research for assessment of changes in Earth's surface using satellite images, spatial analysis, and application of spectral mixture models.

WORKSHOP:
“Accessing, mapping and exporting Nitrogen Dioxide data on Google Earth Engine”

In this workshop, we will cover how to access the air pollution data collected by the TROPOMI orbital sensor on Google Earth Engine, with an emphasis on nitrogen dioxide measurement, which has been used in many media examples as a proxy for mapping the intensity of activities during pandemic and lockdown periods. Nitrogen dioxide is strongly associated with urban activities and the burning of fossil fuels, such as diesel oil and also industrial activities, and analysing its temporal space distribution can give some interesting indications about human activities and their intensity on the Earth's surface.

Materials and Equipment:
  1. Laptop or Computer
  2. Internet Connection
  3. Google Earth Engine Account

Dr. Paula Moraga

Dr. Paula Moraga who is also the keynote speaker of the conference, is an Assistant Professor of Statistics at the King Abdullah University of Science and Technology (KAUST) and the Principal Investigator of the Geospatial Statistics and Health Surveillance Research Group. Paula has published extensively in leading journals and is the author of the book 'Geospatial Health Data: Modeling and Visualization with R-INLA and Shiny' (2019, Chapman & Hall/CRC). Paula received her Ph.D. degree in Mathematics from the University of Valencia, and her Master's degree in Biostatistics from Harvard University.

WORKSHOP:
Disease Risk Modeling and Visualization using R-INLA

Disease risk models are essential to inform public health and policy. These models can be used to quantify disease burden, understand geographic and temporal patterns, identify risk factors, and measure inequalities. In this workshop we will learn how to estimate disease risk and quantify risk factors using aerial and geostatistical data. We will also create interactive maps of disease risk and risk factors, and introduce presentation options such as interactive dashboards. We will work through two disease mapping examples using data of malaria in The Gambia and cancer in Pennsylvania, USA. We will cover the following topics:

  • Model disease risk in different settings
  • Manipulate and transform point, areal and raster data using spatial packages
  • Retrieve high resolution spatially referenced environmental data using the raster package
  • Fit and interpret spatial models using Integrated Nested Laplace Approximations (INLA)
  • Map disease risk and risk factors using leaflet and ggplot2

The workshop examples will focus on health applications, but the approaches covered are also applicable to other fields that use georeferenced data including ecology, demography or the environment. The workshop materials are drawn from the book 'Geospatial Health Data: Modeling and Visualization with R-INLA and Shiny' by Paula Moraga (2019, Chapman & Hall/CRC).

Contact

If you have any questions, please contact us via email. Alternatively, please write to us at our mailing address listed below.

Mailing address

Institute for Geoinformatics
Heisenbergstraβe 2, D-48149
Münster Germany

Twitter Feed

Sponsors & Partners

GeoMundus is looking for sponsors and partners from all the spatial, technological, public or private, scientific, governmental, academic and more fields. We will be thrilled to have all the support and participation in this international event.

Please feel free to contact the budget team at budget@geomundus.org for more information on how to help and contribute! We will be glad to hear all the wishes to sponsor the 2020 GeoMundus conference and future years.

Partners


Sponsors